Image Processing Project - I: Bottles Label Detection (Part 2)
by Yifei Zhou
3.7 Deformed Bottles
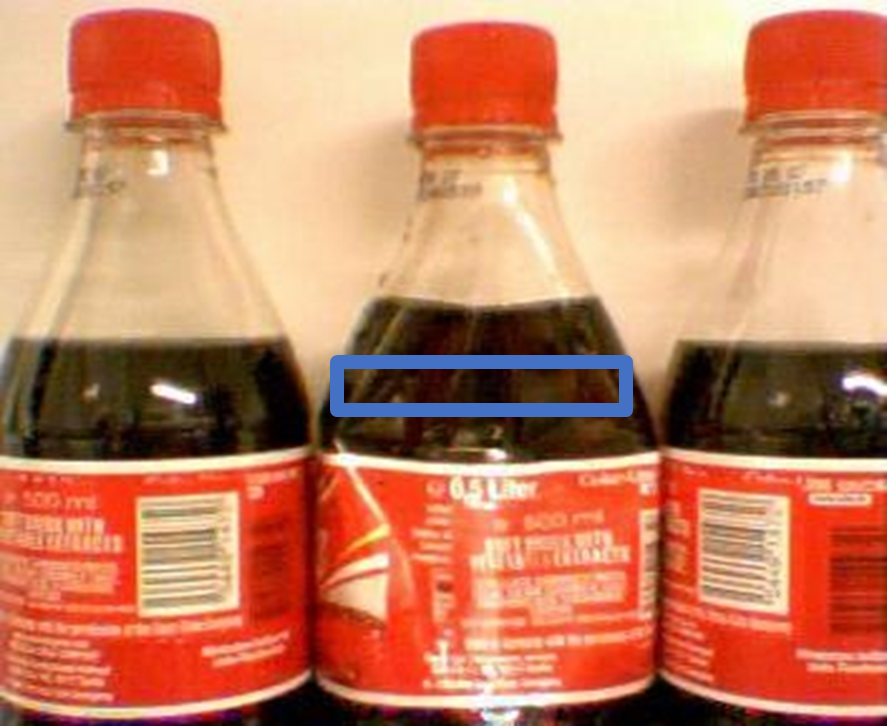
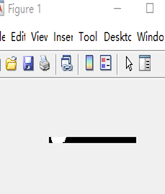
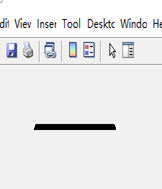
The last and most complicated one is deformed bottles detection. For this task, the interesting area I selected is the horizontal area nearby the label. The aim is to compare the length of bottle. If the bottle was deformed, the width would be enlarged or shrunk significantly. The figure shows the binary images for normal image, shrunk bottle and enlarged bottle images respectively. Obviously, I can observe that the black and white pixels distribution has a significant difference. Therefore, I set two thresholds to judge. The code segment below shows this approach. (45<=White pixels<=110 and 630<=Black Pixels <=680) Normal. The bottle whose pixels were not in the range was reported deformed.
 |
| Figure 3.7.1 Normal Bottle Image |
 |
 |
| Figure 3.7.2 Shrunk bottle Image | Figure 3.7.3 Enlarged bottle Image |
 |
 |
 |
| Normal Bottle | Shrunk Bottle | Enlarged Bottle |
The figure shows the binary images for normal image, shrunk bottle and enlarged bottle images respectively. Obviously, I can observe that the black and white pixels distribution has a significant difference. Therefore, I set two thresholds to judge. The code segment below shows this approach. (45<=White pixels<=110 and 630<=Black Pixels <=680) Normal. The bottle whose pixels were not in the range was reported deformed.
function [judge]=bottle_deformed(bin_img)
zone_area=bin_img(140:145,115:235);
%select the interesting area [counts,bins]=imhist(zone_area);
judge=0;
if (counts(1,1) >=630 & counts(1,1) <=680) & (counts(2,1) >=45 & counts(2,1)<=110) %satistics the white and black pixels distribution.(for normal bottle)
judge=0;
elseif counts(2,1) >=600 %white pixels too many, reported as under-filling
judge=0;
else	%not in the range was reported deformed
judge=1;
end
end
4. Evaluation of System
4.1 Faults Detection Separately
In this section, I mainly applied those faults detection to check the accuracy. The first evaluation is faults detection separately. The code segment below illustrates this step. (Note: You need to change the file path)
m_folder_underfilled="E:\MasterStudy\EE551\1-UnderFilled";
m_folder_overfilled="E:\MasterStudy\EE551\2-OverFilled";
m_folder_Nolabel="E:\MasterStudy\EE551\3-NoLabel";
m_folder_NoPrint="E:\MasterStudy\EE551\4-NoLabelPrint";
m_folder_notstright="E:\MasterStudy\EE551\5-LabelNotStraight";
m_folder_capmissing="E:\MasterStudy\EE551\6-CapMissing";
m_folder_deformed="E:\MasterStudy\EE551\7-DeformedBottle";
m_folder_missing_tb="E:\MasterStudy\EE551\MissingBottle";

% Underfilled filepattern=fullfile(m_folder_underfilled,'*.jpg');
jpegFiles=dir(filepattern);
count=0;
for k=1:length(jpegFiles)
baseFileName=jpegFiles(k).name;
fullFileName=fullfile(m_folder_underfilled,baseFileName);
[gray_img,bin_img]=pre_process(fullFileName);
[judge]=under_filling(bin_img);
if judge==1
count=count+1;
end
end
fprintf("The detected underfilling faults %d/%d found\n",count,length(jpegFiles));
%Print accuracy
%......Same as another 6 defaults |
| Figure 4.1 Detection result for each faults |
As shown in figure 4.1 above, it shows the detection results of each fault separately. There was only one fault existing in detection of non-straight labels bottle.
4.2 Combination Faults Detection
In addition, sometimes one bottle may have more than one faults, For example, the bottle were overfilling and missing labels. This system also has ability to detect all potential faults existing in bottles. The code below segment illustrates this step.
m_folder="E:\MasterStudy\EE551\All"; %file path for randomised images
m_folder_combine="E:\MasterStudy\EE551\Combinations";	%file path for combinations faults path
if ~isdir(m_folder)
    errorMessage=sprintf("Errror !!!");
end
filepattern=fullfile(m_folder_combine,'*.jpg');
jpegFiles=dir(filepattern);
m=[];
has_bottle=[];
for k=1:length(jpegFiles)
  cap=0;miss_lb=0;under_fill=0;over_fill=0;deformed=0;lb_not_st=0;blank_lb=0;
  %7 bool variables to hold different faults baseFileName=jpegFiles(k).name; fullFileName=fullfile(m_folder_combine,baseFileName); [gray_img,bin_img]=pre_process(fullFileName); [judge]=missing_bottle(bin_img);

  if judge==1
    fprintf('The bottle is missing %d',k);
  else
    has_bottle=[has_bottle;[k]]; cap=missing_cap(bin_img); %if the cap is missing
    under_fill=under_filling(bin_img); %if it is underfilling (conflict with overfilling)

    over_fill=over_filling(bin_img);	%if it is overfilling (conflict with underfilling)

    if over_fill==1
      under_fill=0;
    end


    [blank_lb,miss_lb]=missing_or_blank_label(bin_img);	%judge if the label is missing or blanked label

    if miss_lb==1
      lb_not_st=0;
    else
      if blank_lb==1
        lb_not_st=0;
      else
        lb_not_st=label_notstright(bin_img);
      end
    end
    [deformed]=bottle_deformed(bin_img);
    m=[m;[cap miss_lb lb_not_st blank_lb under_fill over_fill deformed k]]; info=print_information(cap,miss_lb,lb_not_st,blank_lb,under_fill,over_fill,deformed
,k);
    fprintf(info);	%formatted output the detection information
  end
end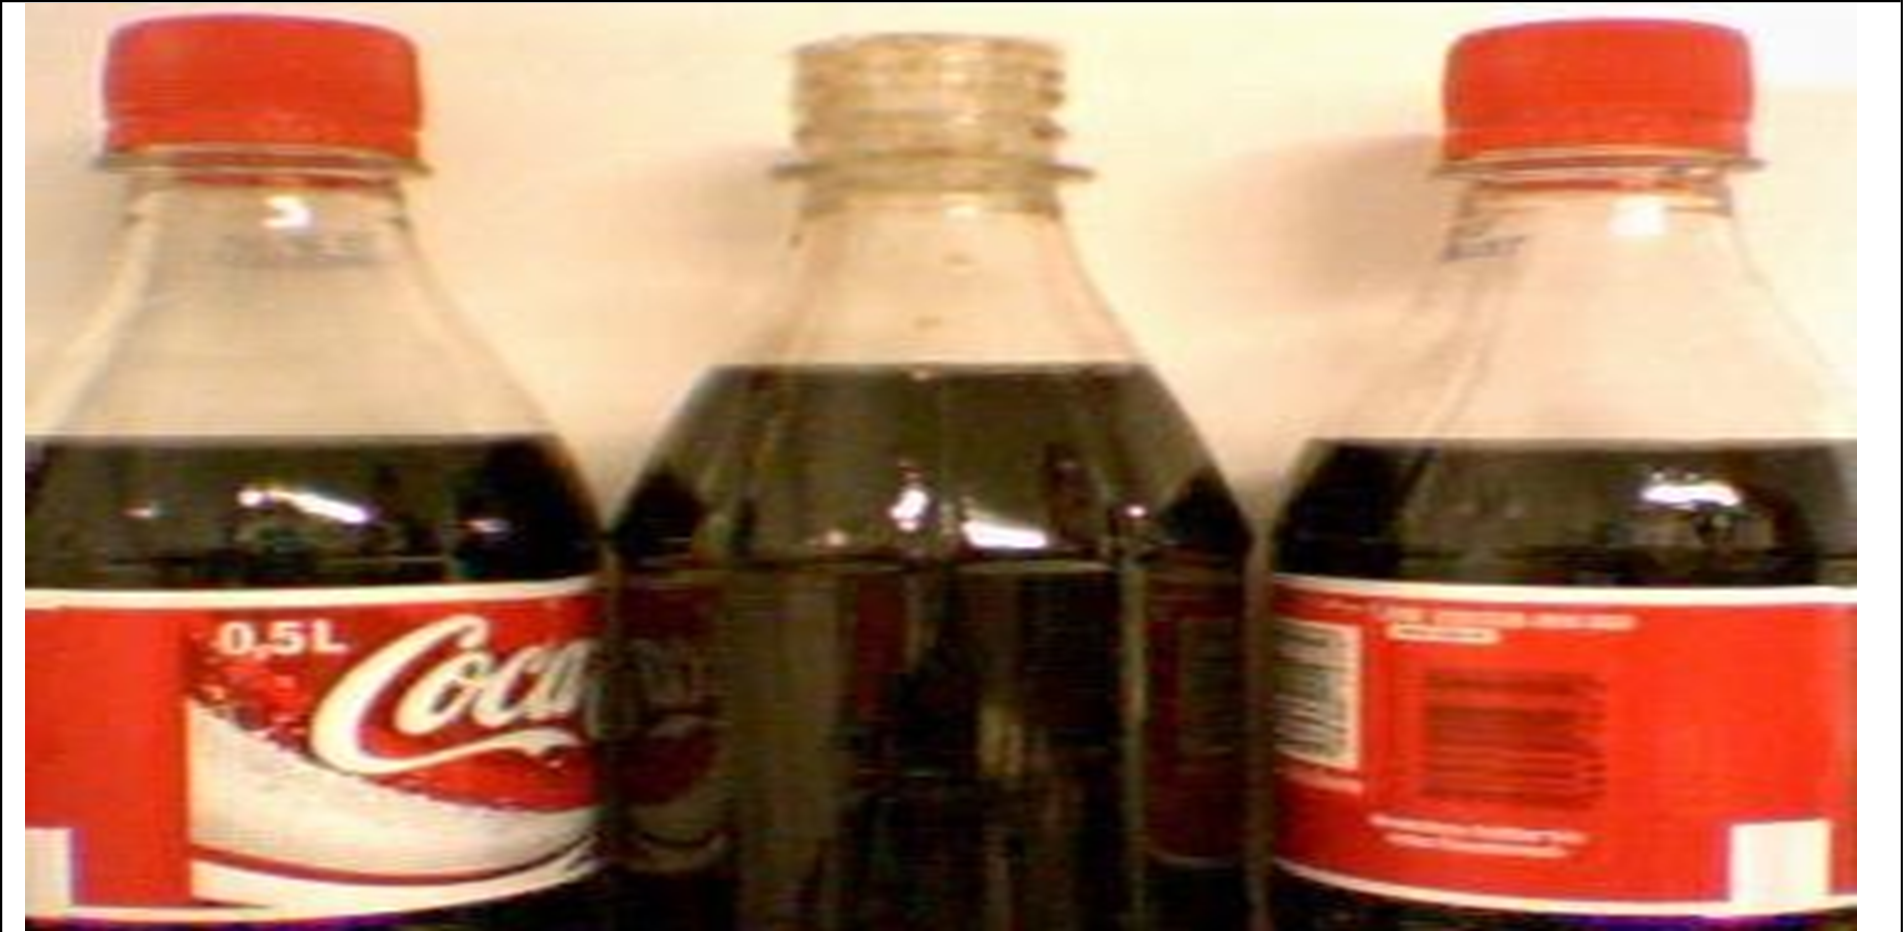 |
| Figure 4.2.1 Combination faults in one bottle |
The figure 4.2 shows the combination faults existing in bottle. Clearly, there were three faults existing in the bottle (Cap missing, over-filling and label missing).
 |
| Figure 4.2.2 Combination faults detection result |
4.3 Randomized Image Detection
In order to evaluate the overall accuracy and system stability, I applied all faults detection techniques into all randomized images. I moved the file path to all randomized images, and calculate the accuracy.
I labelled all testing images manually as testing set which is used to compare the result with the system prediction. I create a matrix (no of images * no of faults), and use 1 to represent fault and 0 represent normal. The figure shows the testing set.
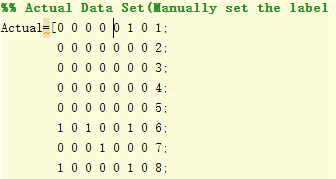 |
| Figure 4.3.1 manually labeled testing set |
After that, I moved my working path to randomized images folder and starts detection. (I have filtering the missing bottles images in code, the last column was as the index of each image) It will also generate the prediction matrix. Similarly, I also got a matrix like that:
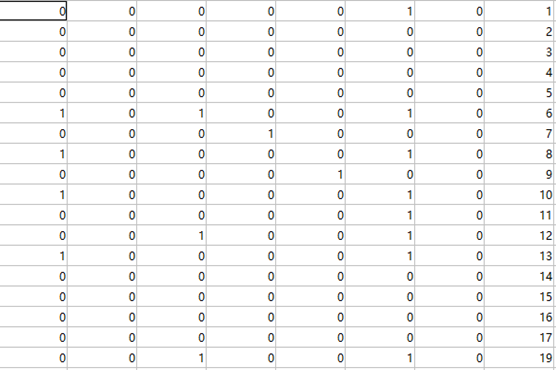 |
| Figure 4.3.2 Prediction Matrix |
In order to calculate the accuracy of each fault, I used a XOR for those two matrix (XOR means if both values are same it will return 0, otherwise it will give 1). In this case, it means the (TP+FN) [The number of cases (correctly detection) + The number of cases (No faults correctly detection)].
Statistis_table=xor(m(:,1:7),Actual(:,1:7));
M_count=sum(Statistis_table(:,1:7))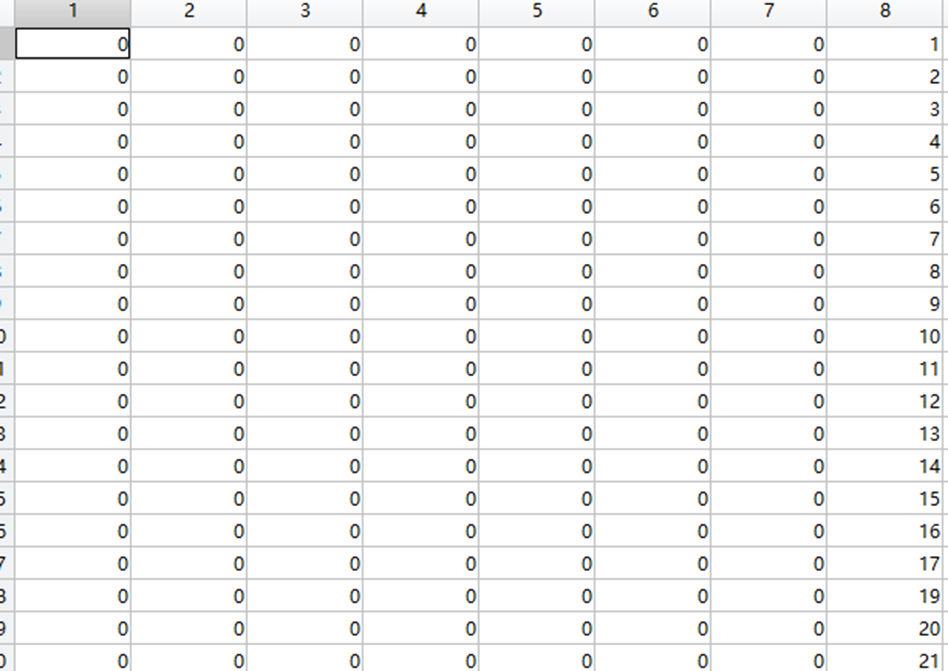 |
 |
| Figure 4.3.3.1 Result matrix | Figure 4.3.3.2 Fault Calculation |
Furtherly, I calculate the overall accuracy for each faults from the code below:
Total_Accuracy=(size(m,1)-M_count)/size(m,1)Besides, I also calculated the precision and recall rate for each fault respectively. The code below segment illustrates the process.
function [precision,recall]=calculate(m_act,m_pre)
  FN=0; TP=0; FP=0;
  for m=1:size(m_act,1)
    if m_act(m)==1 & m_pre(m)==0
      FN=FN+1;
    elseif m_act(m)==0 & m_pre(m)==0
      TP=TP+1;
    elseif m_act(m)==0 & m_pre(m)==1
      FP=FP+1;
    end
  precision=TP/(TP+FP) recall=TP/(TP+FN)
  end
end| —- | Cap Missing | Label Missing | Lab not Straight | Blank Label | Under Filling | Over Filling | Deformed |
| Accuracy | 100% | 100% | 91.4% | 100% | 100% | 100% | 98.4% |
| Precision | 100% | 100% | 91.4% | 100% | 100% | 100% | 98.3% |
| Recall | 100% | 100% | 99% | 100% | 100% | 100% | 100% |
From the evaluation table, I found that there existing some drawbacks in the detection of not straight label and deformed table.
5. Conclusion
In conclusion, there are still some improvement spaces for the faults detection. And the detection techniques seems more singular, I hope that I could improve the performance in the future using more flexible and complicated approaches.
