DA Case Study-I (Group) — Geography Data Analytics
by Yifei Zhou & Eoghan Keany
Section 1: Satellite Image Classification
introduction
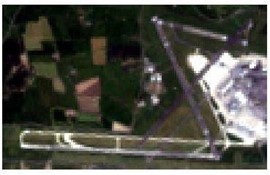
The objective of this assignment was to implement the QGIS software package in a simple classification task within a satellite image. We were given two satellite images of the same geographical location that were separated in time. The first image was produced in 2001 and the second 2018. Our aim was to distinguish and analyse the changes that occurred during this timeframe.
Clip and Reflectance
At first a region of interest was selected from both images by using the clip operation. As the QGIS software uses the UTM coordinates system the top left and bottom right point of the graph are referenced as TL: 679751.453(x) 5924545.88(y) and BR: 683459.533(x) 5922367.64(y). Once these regions have been selected the reflectance operation provided in the QGIS package was implemented. For the historical image, figure 1.1, the bands 1, 2, 3, 4 and 5 were chosen with Landsat 7, and for the most recent image figure 1.2, bands 2, 3, 4, 5 and 6 were applied with Landsat 8.
 |
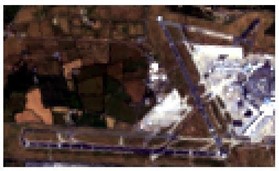 |
| Figure 1.1 Satellite image in 2001 (Landsat7) | Figure 1.2 Satellite image in 2018 (Landsat8) |
In order to find the location of the satellite image, a transformation was needed to convert the coordinates from UTM into latitude and longitude. As the UTM system divides the Earth into sixty zones, each containing a six-degree band of longitude, a zone number is an essential piece of information for a correct transformation. Assuming that this image was taken in Ireland, this indicates that the system referred to zone 29. Post transformation, two separate points for each image were found (53°26'21.3"N, 6°17'37.4"W) and (53°25'06.3"N 6°14'21.2"W) respectively. The midpoint between these two points was calculated as this gives a more accurate representation of the exact position. Using the google geocoder package the address of the midpoint was located in Dublin Airport. Therefore, we conclude that these two images are located at Dublin Airport.
from geopy.geocoders import Nominatim
nom=Nominatim(user_agent="Eoghan & Bob",timeout=20)
g=nom.reverse("53.42883 -6.2664765") #The central point print(g)
print(g)
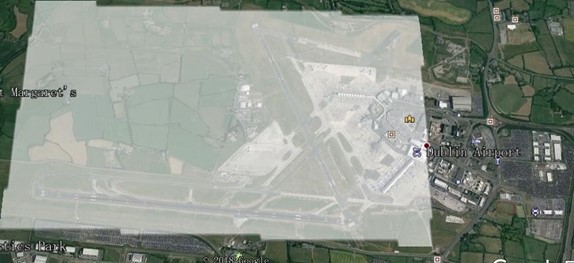
## Old Naul Road, Huntstown, Airport ED, Saint Margaret’s, Fingal, County Dublin, Leinster, K67 D6P0, IrelandAn alternative method to find the location of each image is to use Google Earth. This approach is less cumbersome than the previous, as no transformations are needed. The clipped images with all bands are imported into google earth, and the resultant location is shown. The conclusion was the same as our previous method however this approach is more efficient and interactive.
Creation of Training Data
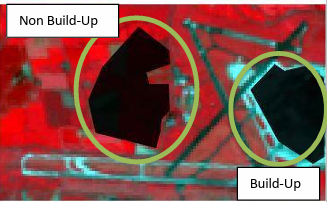
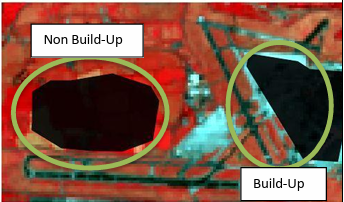
The next step was to create the training data necessary for the classification task. In this case, we used the RGB (4-3-2) format image to display the image. This format allows us two represent the two separate class areas as either red or blue blocks allowing the user to easily distinguish between them. As shown in those two figure 1.2.1 and figure 1.2.2, only two classes were created Built up and Non-Built up with each class being a label for a collection of micro classes.
 |
 |
| Figure 1.2.1 Training samples in old picture | Figure 1.2.2 Training samples in new picture |
Classification and Analysis
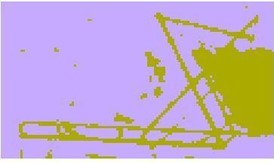
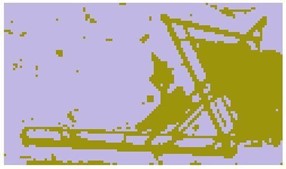
Finally, the Maximum likelihood classification algorithm was used to convert the images into a binary representation of built up and non-built up regions. The Figures 1.3.1 and 1.3.2 are a side by side comparison of Dublin airport from 2001 to 2018. One major difference between the two images is the addition of more manmade structures this new area is indicated by the red bounding box. We believe that this new area represents terminal two which was constructed and finished within this time period.
Legend: Non-Build Up Non-Build Up  Build Up Build Up |
|
 |
 |
| Figure 1.3.1 Classification Result (Before) | Figure 1.3.2 Classification Result (After) |
Section 2: Multi-Source Open Data Quality Observations.
The objective of this assignment was to create a complete and clean dataset of the playing pitches in the greater Dublin area using three datasets found on the Irish Open Data Strategy repositories. The resulting dataset needed to be in the csv file format and retain as much information as possible from the starting datasets.
From an initial observation of the data these are the discoveries found: Within the collection of datasets two different data types can be found, one in the xml format and the other two were comma separated. Each dataset contained a unique set of columns with little overlap which can be viewed in the table below.
| Dataset | Column 1 | Column 2 | Column 3 | Column 4 | Column 5 |
|---|---|---|---|---|---|
| one | PARK | AREA | CLUBNAME | LEAGUE | n/a |
| two | FACILITY_TYPE | FACILITY_NAME | Location | LAT | LONG |
| three | Location | Number | Size | Latitude | Longitude |
Further inspection revealed that the second and third datasets both contained missing values. These values were exclusively contained in the ‘LOCATION’ column of the second dataset. Whereas, they are scattered throughout every column in the third dataset but mainly reside in the ‘Location’ column also. Dataset two had 23 missing values in total and dataset three had 52 missing values in total with the following column distribution.
| Dataset 2 | Dataset 3 | ||
|---|---|---|---|
| FACILITY_TYPE | 0 | Location | 46 |
| FACILITY_NAME | 0 | Number | 1 |
| LOCATION | 23 | Size | 3 |
| LAT | 0 | Latitude | 1 |
| LONG | 0 | Longitude | 1 |
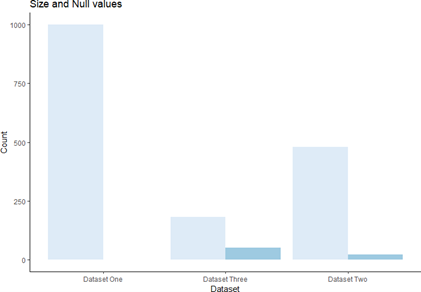 |
| Fig 2: The total size of each dataset also varied. Shown below is the size and null values of all three datasets, the dark blue bars represent the total number of missing values in each dataset |
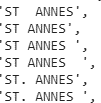
All three datasets had conflicting grammatical formatting as some columns contained exclusively uppercase words and others lower case. Also a few spelling/grammatical mistakes were found within the first dataset with regards to the park names.
 |
 |
The format of the location column also widely varied within dataset two as some pitches location were described by their Dublin postal districts (Dublin 15,12..etc) while others were described by their town. Conflicts between the accuracy/precision of the location value can also be witnessed as some rows display an area with the townland itself.
 |
 |
Data modelling
As a collective, the three datasets do not share the same data model. Only the second dataset contains the required three columns stipulated in the objective. The ethos of our approach was to create a uniform and complete dataset. Therefore the following columns size, number and league were excluded immediately as they were considered irrelevant as their data was either incomplete or impossible to accurately extend the other datasets. The columns “facility type” and “club name” were both considered for the master dataset as it was theorised that by using the geocoder.reverse() function you could indeed get the club name for a pitch using its latitude and longitude. However there were too many missing values which conflicts with our ethos of having a complete dataset. Similarly the facility type could be computed for some pitches. By using the club name of a team that played at that pitch, you could infer the type of sport that was played eg.( soccer F.C, Celtic, United thus it must be a soccer pitch). Although, as a truly complete attribute could not be achieved, it too was excluded. Therefore the four columns chosen for our data model before data enriching were
- Facility_Name: refers to the park or local area that the pitch is located.
- Location: describes the town in which the park is situated.
- Latitude: refers to the geographical value of the pitches position on the globe.
- Longitude: refers to the geographical value of the pitches position on the globe.
The logistics of this model were complicated as there were issues with the datasets themselves such as missing fields, different field names, missing values and non-uniform format either structurally or grammatically. Both the Latitude and Longitude columns are self-explanatory and were computed for the first column but the location and facility name columns are more ambiguous.
From the observations, it was noted that the two reference location columns were conflicting. The third dataset had a more precise location compared to the second dataset and even within the second dataset the precision varied from town to postal districts. eg Killboggat park is the location found in the third dataset but the address of this park is Churchview Rd., Killiney, Co. Dublin. Therefore this column had more in connection with the PARK and Facility_Name columns from the previous two datasets thus a new column was added to store this data. The first and second datasets had the complete information required for the column although the string “park” was added to any parks in the first dataset without the word in their title to have a more comprehensive grasp of their area. The third dataset also had a series of missing values so these where filled using the ffill() function provided by the pandas module which fills a cell based on the previous cell entry. These three complete columns were then used to create a uniform “facility_name” column. A definition for the location column was defined as the town name just before the Dublin postal address. Due to the missing data in the second dataset, a function was needed to fill and format the location column to the defined structure. The third dataset and first dataset location columns were created by using the geographical coordinates and the geocoder.Reverse function.
| Column 1 | Column 2 | Column 3 | Column 4 |
|---|---|---|---|
| FALCUTY_NAME | LOCATION | LAT | LONG |
Table 2.2 The table represents the data model chosen before data enrichment.
Data Parsing
The csv formatted datasets were parsed into a Jupyter notebook by using the Pandas python module which is an essential tool when dealing with tabulated data. Unfortunately pandas doesn’t have a function to read and store an xml file as a data frame therefore a custom parser was created using the xml.etree.cElementTree which is a container object designed to store hierarchical data structures in memory. The requests module allows you to get a response from the url address. For each block in the xml file the corresponding field values were found using the xml.etree module and stored in a pandas data frame.
import xml.etree.cElementTree as et
import requests

URL="https://data.smartdublin.ie/dataset/cd013b8e-912e-4894-b17d-3b7a17d1c9cb/"+"resource/76ed9024-0665-4af3-ae20-6b94dfdc25b1/download/fccplayingpitchesp20111203-1424.xml"
XML=requests.get(URL)
root=et.fromstring(XML.content)

def getvalueofnode(node):
  return node.text if node is not None else None

def xml_dataframe():
  dfcols=['FACILITY_TYPE','FACILITY_NAME','LOCATION','LAT','LONG']
  df_xml=pd.DataFrame(columns=dfcols)

  for child in root:
    for grandchild in child:
      fac_type=grandchild.find('FACILITY_TYPE')
      fac_name=grandchild.find('FACILITY_NAME')
      loc=grandchild.find('LOCATION')
      lat=grandchild.find('LAT')
      long=grandchild.find('LONG')

      df_xml=df_xml.append(pd.Series([getvalueofnode(fac_type),getvalueofnode(fac_name),getvalueofnode(loc),getvalueofnode(lat),getvalueofnode(long)],index=dfcols),ignore_index=True)

  return df_xml
Incomplete Data
Incomplete data was one of the challenges associated with this project. It had a direct impact on our data model and the creation of the final dataset. In order to produce the four complete attributes defined by the model there where three main steps involved in overcoming the lack of data.
Dataset one
From the initial observations this data frame was complete and had no missing values. However only one of its four columns were valid with regards to the data model. To overcome this problem the geographical coordinates and location were added to the first dataset to create the necessary columns. This challenge had two solutions, either using the geocoder library or manipulating a 4th dataset containing the geographical coordinates of each town in Ireland. For this project the geocoder library was chosen and implemented in python. This module uses goggle maps to return a tuple containing the full address and geographical coordinates given partial information about the address.
from geopy.geocoders import Nominatim

nom=Nominatim(user_agent="Eoghan & Yifei",timeout=20)
df['COORIDINATES']=df.loc[:,'PARK'].apply(lambda x: nom.geocode(x))
df['ADDRESS']=df.loc[:,'COORIDINATES'].apply(lambda x: nom.reverse([x[1],x[2]]))
This method was preferred for its elegant implementation and precision which is far superior to that of the 4th dataset. One drawback of this approach is caused by the limited information provided causing some of the returned values to be incorrect or even produce None values throwing errors into the program. The execution time is also an undesirable aspect however I theorise that it would be somewhat comparable to that of the search time required if using the 4th dataset. To overcome the None values four location and geographical coordinates were defined and added to the dataset.
def conditions(df):
  if(df['PARK'] == 'JOHN PAUL PARK, DUBLIN'):
    return((('Cabra'),53.3664,-6.3056))
  elif (df['PARK'] == 'FR. COLLINS PARK, DUBLIN'):
    return ((('Donaghmede'),53.4052,-6.1607))
  elif (df['PARK'] == 'LEIN ROAD PARK, DUBLIN'):
    return ((('Donaghmede'),53.382210,-6.188190))
  elif (df['PARK'] == 'MC AULEY PARK, DUBLIN'):
    return ((('Donaghmede'),53.382340,-6.192390))

noneValues['COORIDINATES']=noneValues.apply(conditions,axis=1)
To produce a location column that conformed to the data model an extract function was written to remove the town name from the tuple-tuple returned by the geocoder. The first element represents the address string, this object was split into the it’s separate address components and the town name was extracted as a pattern was noticed where the element before the Dublin postal code contained either the word ED or A ED. Thus this pattern was searched for in each element of the address and the corresponding match returned.
def extract(df):
  if df!=None:
    result = [a.strip() for a in df[0].split(',')]
    ans=find_location(result)
    return (ans)
  else:
    return None;

def find_location(x):
  after_format=""
  result=""

  for i in range(len(x)):
    if "ED" in x[i]:
      after_format=x[i]
      break;
    if (re.match("Dublin ([0-9]+)",x[i])):
      after_format=x[i-1]
      break;

  invalid=['South','East','North','West']
  for m in after_format.split(' '):
    if ((m not in invalid) & (len(m)>=3)):
      result+=m + ' '
  return result.strip()

hasValues.loc[:,'LOCATION']=hasValues.loc[:,'COORIDINATES'].apply(extract)
Dataset Two
This dataset was the most complete with regards to the data model. It contained the four required attributes, although the location column was missing values. This column was completed using the geographical coordinates given and the geocoders.reverse function. A custom function was created to extract the town name from returned location tuple that used the pattern that each address in Fingal County had a postal district therefore the address component before this must be the town name. To save processing time the dataset was filtered based on missing values and the function was only applied to this smaller incomplete data frame, post application these two complete data frames were then concatenated together to achieve a completed dataset 2.
def hasNumbers(inputString):
  return any(char.isdigit() for char in inputString)

def extract2(df):
  result= [a.strip() for a in df[0].split(',')]
  if hasNumbers(result[-6]):
    return result[-7]
  else:
    return result[-6]

morenoneValues = df_2[df_2['LOCATION'].isnull()]
morenoneValues['Geotag']=morenoneValues.apply(lambda x: nom.geocode([x['LAT'],x['LONG']]),axis=1)
morenoneValues['LOCATION']=morenoneValues['Geotag'].apply(extract2)
morenoneValues=morenoneValues.drop(["Geotag"],axis=1)
df_2=pd.concat([new_df_2,morenoneValues],ignore_index=False)
Dataset Three
This dataset had a series of missing values and didn’t contain the correct location column from the data model. Similarly, to the previous dataset a function was built around the geocoders.reverse function to extract the town name from the geographical coordinates. It was found that all these location resided in the same town area of DÚN LAOGHAIRE-RATHDOWN.
def extract3(df):
  if df!=None:
    result=[a.strip() for a in df[0].split(',')]
    for i in range(len(result)):
      if (result[i]=='County Dublin'):
        return result[i-1]
  else:
    return None;
Data Cleaning
Dataset One
Initially this dataset was complete however after the new columns were added a few none values were returned by the geocoder. To overcome this problem the data frame was split into two, one that contained all the missing values and the other that had the filtered dataset. The absent values were filled by hardcoding the four missing places these two data frames where then merged to create a complete set.
noneValues=df1.loc[df1.loc[:,'COORIDINATES'].isnull(),:]
noneValues.loc[:,'COORIDINATES']=noneValues.loc[:,'PARK'].apply(conditions)
noneValues.loc[:,'LAT']=noneValues.loc[:,'COORIDINATES'].apply(lambda x: (x[1])
noneValues.loc[:,'LONG']=noneValues.loc[:,'COORIDINATES'].apply(lambda x: (x[2])
noneValues.loc[:,'LOCATION']=noneValues.loc[:,'COORIDINATES'].apply(lambda x: (x[0])

hasValues=df1.dropna(how='any',axis=0)
hasValues.loc[:,'LONG']=hasValues.loc[:,'COORIDINATES'].apply(lambda x: (x.longitude))
hasValues.loc[:,'LAT']=hasValues.loc[:,'COORIDINATES'].apply(lambda x: (x.latitude))
hasValues.loc[:,'LOCATION']=hasValues.loc[:,'COORIDINATES'].apply(extract)
Also a few locations were in the incorrect places in Dublin therefore these values were also corrected.
new_df.loc[new_df.loc[:,'PARK']=='KILMORE PARK',['LAT','LONG','LOCATION']]=[53.3944,-6.2268,'KILMORE']
new_df.loc[new_df.loc[:,'PARK']=='NAUL PARK',['LAT','LONG','LOCATION']]=[53.394899,-6.260850,'SANTRY']
new_df.loc[new_df.loc[:,'PARK']=='ST ANNES PARK',['LAT','LONG','LOCATION']]=[53.370820,-6.173616,'CLONTARF']
new_df.loc[new_df.loc[:,'PARK']=='STREAMVILLE PARK',['LAT','LONG','LOCATION']]=[53.394429,-6.173577,'CLAREHALL']
new_df.loc[new_df.loc[:,'PARK']=='PEARSE PARK',['LAT','LONG','LOCATION']]=[53.323564,-6.314753,'CRUMLIN']
To limit the geocoder to the Dublin area Dublin was added to the string address. Therefore post application this had to be removed also my partner and I agreed to add the word park to every value in the park column before renaming it to facility name.
Dataset Two
As seen above this dataset contained 23 missing values within the location column that were filled using a custom function. From further observation the format of this column was inconsistent therefore any values that contained the Dublin postal code instead of the town name were edited using a function that extracts the correct town name one address component before the Dublin postal district in the location tuple.
Dataset Three
This dataset had the most missing values of any of the three datasets with 53 missing values in total. The majority of these values where contained in the location column. To combat this problem the ffill() method from the Pandas python module was used to create a complete dataset. This function fills any empty cells by using the information contained in the cell above. This approach was taken as it was hinted in the assignment description that “it should take the values of the previous line”. In hindsight this was not the most accurate method. As the geographical location could have been used in conjunction with the geocoder.reverse to retrieve the facility name. However as seen after plotting that all these locations reside within DÚN LAOGHAIRE- RATHDOWN area it doesn’t have a huge impact on the final dataset.
Universal Cleaning
These formatting issues were shared between all three datasets, therefore they were all addressed when the final dataset was created. Each column was forced into uppercase. Spelling mistakes were addressed mainly contained to the first dataset. Within the location column issues with town names either being double barrelled or containing a cardinal direction such as north, south. Any other formatting issue such as hyphens or spaces
Duplicate values were also removed based on latitude and longitude values. Although the final dataset may have rows that are identical apart from these two columns. I believe that this is the correct method. As the final dataset should contain information about the about the pitches in Dublin therefore a single park may contain multiple pitches. Another thought as to remove duplicates based on the other attributes and create another column that represents the number of pitches or duplicates for each facility removed. However then the geographical location of each pitch would be lost?
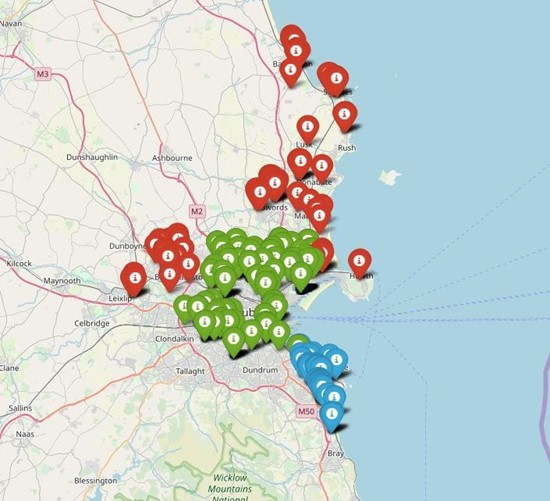
This figure is a plot of the geographical location of all three datasets. The red markers represent the Finga county dataset, blue: DLR dataset and green the DCC dataset.
 |
Data Enrichment
After the data model was achieved, three more complete columns were added to the final dataset.
Area: this attribute describes the cardinal position of the pitch with respect to the center of Dublin. The information was generated using basic trigonometry on the geographical points of each pitch. There are 11 positions ["NORTH", "NORTH EAST", "EAST", "SOUTH EAST", "SOUTH", "SOUTH WEST", "WEST", "NORTH WEST", ‘CENTRAL NORTH’ and ‘CENTRAL SOUTH’] the standard nine cardinal positions are self-explanatory. However the central north and south refers to the inner city pitches just below and above the river Liffey, whereas north and south would infer Co Dublin.
def directions_lookup(LONG, LAT):
  deltaX=LONG - 6.266155
  deltaY=LAT - 53.350140
  degrees_temp=math.atan2(deltaX,deltaY)/math.pi*180
  if degrees_temp<0:
    degrees_final=360+degrees_temp
  else:
    degrees_final=degrees_temp

  compass_bracket=["NORTH","NORTH EAST","EAST","SOUTH EAST","SOUTH","SOUTH WEST","WEST","NORTH WEST","NORTH"]
  compass_lookup=round(degrees_final/45)
  return compass_bracket[compass_lookup]

df_2['AREA']=df_2.apply(lambda x: directions_lookup(x['LONG',x['LAT']]),axis=1)
County Council: This column contains information about which council is responsible for each pitch. This column was inferred as each of the three datasets from the data.gov website was produced by an individual council. Such as Fingal county, Dublin city council and Dun Laoghaire- Rathdown council.
Postal District: This column refers to the postal code for each pitch. This was extracted by using the geographical coordinates in conjunction with the geocoders.reverse function where the second last postal element was extracted. This application worked although a few outliers where present in the data that had no exact postal code therefore their Dublin city postal district was used instead as this just refers to the first three letters of the postal code anyways.
def find_address(a,b):
  res=str(a)+' '+str(b)
  res=nom.reverse(res)
  return res.address[0]

def format_postal(x):
  if x.isdigit():
    return "DUBLIN "+x
  elif ' ' not in x:
    return x[0:3]+' '+x[3:]
  return x
References
- https://pandas.pydata.org/pandas-docs/stable/
- https://geopy.readthedocs.io/en/stable/
- https://earthexplorer.usgs.gov/
- https://qgis.org/en/site/forusers/download.html
- https://fromgistors.blogspot.com/2018/02/basic-tutorial-1.html#more
- https://fromgistors.blogspot.com/p/plugin-installation2.html
